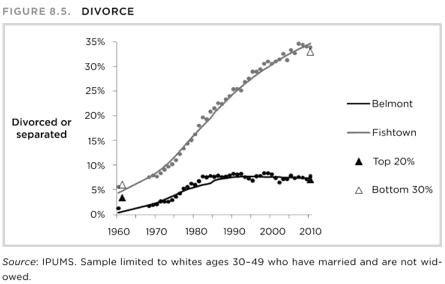
I have a predictably optimistic take on Charles Murray’s Coming Apart. But these two graphs did indeed shock me. The first contrasts divorce rates for working class (“Fishtown”) and professional (“Belmont”) whites:
Murray’s second shocking graph shows the fraction of working class and professional whites who say they’re happily married:
Still, as Kahneman reminds us, “Nothing in life is as important as you think it is when you’re thinking about it.” If you double-check in the GSS, you’ll find that overall happiness has been virtually constant since the survey began in 1972. On a 3-point scale, happiness has decreased by .001 per year. Current trends could continue for a century before we’d see a tenth of a point decline in average happiness. So quit yer mopin’.
READER COMMENTS
MS
Feb 3 2012 at 4:57am
How much of this is explained by professional whites marrying and getting children later in life whereas the working class still marries and becomes parents relatively early (in line with the dreams of a life á 1950 among social conservatives)?
In my (European) capital mean age at first childbirt among professional women has increased significantly during the last 20-30 years (and is now well above 30).
Badger
Feb 3 2012 at 7:29am
MS makes a very good point. We’re talking about people that marry at different moments in their lives, and their life dynamics has changed unequally across the decades. I know people that had their Fishtown moment earlier in their lives and now live a Belmont moment. It’s hard to make inferences based on measurements that are so aggregated, broad and open ended. You’d need real panel data for reliable conclusions.
The way it’s been presented, it’s nothing more than wild speculation.
Chris Koresko
Feb 3 2012 at 2:47pm
These data are indeed interesting. They appear to be showing a bifurcation of American social structure along lines that more or less match the bifurcation in family incomes.
I propose as an hypothesis that these effects have a common root cause, namely the creation of a poverty trap via the implementation of the Great Society programs which came into effect at the end of the 1960s. Although there is an unfortunate gap in the data between around 1961 and 1970, it looks as if there was a positive inflection in the divorce rate in “Fishtown” right around that time. That might be explained by the buffering of the impact of divorce on women and children as social subsidies became more important.
This also seems to correlate with a decline in the industriousness of working-class men, and with the end of a steady decline in the poverty rate (which has been bobbling around 5% since 1970, with the bobbles being strongly anticorrelated with GDP growth)
So the narrative is that the Great Society disincentivized virtuous behavior (hard work, promise keeping) for the working class by increasing their effective marginal tax rate to around 1, while the effect on people with upper-middle class and higher incomes is smaller.
Bryan Willman
Feb 4 2012 at 11:46am
There’s a trap, and an “it’s even worse than it looks” aspect.
The trap is that “happiness” is a kind of regulatory mechanism, and baring something like war, is probably relatively constant. In short, “happiness” is NOT a substitute for “well being” or even “quality of life”. That matters because changes in “happiness” over time aren’t necessarily very informative (in either way.)
The “it’s even worse” bit is that I know (many of us do) a fair number of couples in “belmont” who are not married. But are as stable or more stable than some large number of middle class married couples, let alone fishtown couples. When 2 people who made millions working in the software industry cohabitate and raise children, it’s really a very very different thing from when 2 poor people shack up. But they will show in the statistics as “unmarried” (and sometimes as “never married”)
Tom
Feb 6 2012 at 12:52pm
Christian Religion and a focus on morality, as was the case in the 30s-early 60s, resulted in a better social situation for the poor.
Comparing the negatives of a society promoting Christian belief, with the negatives of a society specifically NOT promoting either Christian nor other religious beliefs, the data seems to show the non-religious negatives as much higher.
I think believers make fewer economically mistaken decisions.
Comments are closed.