Whenever someone claims that income affects people’s politics, I always ask, “Have you controlled for education?” I’ve spent over a decade playing with public opinion data. I know from experience that if you’re trying to predict people’s opinions using both income and education, education almost always crushes income. As a rule, so-called income effects are education effects in disguise.
As a result, I was skeptical when I first heard about Martin Gilens finding that American democracy primarily responds to the preference of the rich. The first question on my mind was, “Did he control for education”?
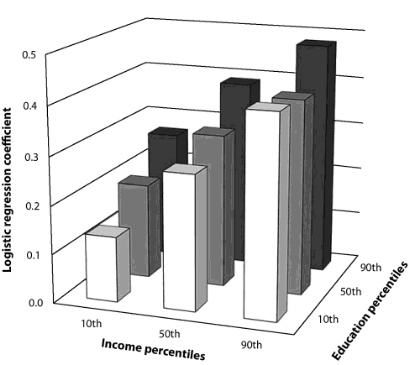
Indeed he did. Yes, Gilens main results simply show political responsiveness as a function of income. As a sensitivity test, though, Gilens tried to predict political outcomes using the subset of survey questions where the 10th and 90th percentiles of the income or education distributions disagreed by at least 10 percentage points. His results:
Still, I have one main reservation. Since education has a much larger effect on policy preference than income does, the overall political effect of education could still easily exceed the overall political effect of income. Suppose, for example, that politicians always heed the rich, but the rich only hold distinctive views 1% of the time. The overall political effect of income on democratic outcomes would still be small. In contrast, suppose politicians give college graduates double weight, but college graduates have distinctive positions on every issue. The overall political effect of education on democratic outcomes would be massive, even though politicians often ignore educated opinion and slavishly obey rich opinion.
Measuring these net effects of income versus education would be labor intensive. Just to ballpark things, however, I’ve emailed Gilens the following question:
In Table A3.4, you restrict analysis to the 1050 questions where the 90/10 income OR education split is 10 percentage points or more.
How many of those questions feature 10-point gaps for *both* income and education? How much for each separately?
If he responds, you’ll be the first to know.
READER COMMENTS
MingoV
Sep 27 2012 at 6:50pm
I have a hard time believing that there are adequate numbers for statistical validity for the group that is above the 90th percentile for income yet below the 10th percentile for education.
I know lots of people above the 90th percentile for education and/or above the 90th percentile for income. I know no one with a high income who is in the bottom 10% for education. The closest is a well-paid master electrician, but he had trade school education beyond high school and is unlikely to be in the bottom 10%.
Steve Sailer
Sep 27 2012 at 7:48pm
Or, perhaps, what really matters is not the views of the 90th percentile of income, but the views of the 99.99th percentile?
Garth Zietsman
Sep 28 2012 at 4:26am
Considering that both education and income are correlated to IQ, and IQ is also related to preferences, I am still interested in the extent to which politicians are listening to intelligent opinion rather than wealth or credentials per se.
BTW I looked at the GSS and found that IQ, education and being female are independently related to a greater liberal/Democrat preference whereas income and age are independently related to a greater conservative/Republican preference.
MG
Sep 28 2012 at 8:49am
Mingo’s point raises another one. How granular is the education variable? If your lowes bucket is identical for 25% of the population, then what is the lowest 10%? Maybe it can also include the electrican in question, which would weaken the shock value of the 90-10 pairing.
Comments are closed.