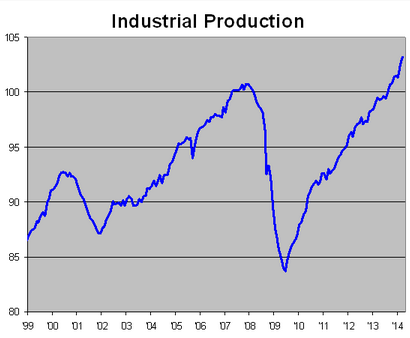
TravisV sent me to the following graph of industrial production:
That looks like good news. To see why it is bad news, we need to take a brief digression. The recent recession has been rather unusual. RGDP fell sharply between 2008 and 2009, and since bottoming out in mid-2009 has grown at about 2.4% annually, which is below the 3% trend line of the past 100 years. This has led many to conclude that the economy is not recovering at all.
A counterargument is that the unemployment rate has fallen from a peak of 10% to the current 6.7%, and in my view it will fall even further over the next year or two. A counter counterargument is that the employment/population ratio fell sharply in the recession, and has not been recovering. A counter counter counterargument is that this partly represents boomer retirement, as the over 55 year old category is where all the recent population growth has been occurring. This is from a recent Joe Weisenthal post:
The counter counter counter counterargument is that labor force participation has even fallen in the 25-54 demographic. This could go on forever—labor force data will never resolve anything.
Here’s what we need to figure out, is the recovery cyclical or is it secular growth? Suppose it was secular growth, what would it look like? In my view we’d expect roughly 2% to 3% growth in the major components of GDP, as output remained cyclically depressed, but grew at the trend rate (so that the recession wasn’t becoming worse.)
Now suppose the secular growth rate had slowed to say 1%, and the economy was briskly recovering toward that new trend line. What then? In that case I’d expect very rapid growth in highly cyclical sectors, and very slow growth in non-cyclical sectors.
Now let’s return to industrial production. This sector (mostly manufacturing but also mining and utilities) is always much more cyclical than RGDP. Whereas RGDP fell about 4.3% peak to trough, IP plunged 16.9%. Since the trough in early 2009, IP is up 23.3% (although the low base in 2009 means we’ve barely passed the previous 2007 peak.)
That might sound like good news—the economy is recovering! But it’s actually bad news. If the economy is recovering then the trend rate of growth must be much less than the anemic 2.4% rate we’ve seen over the past 4.5 years. I’d guess that 1% to 1.5% is the “new normal.” And not just in the US, but also in other (non-Obama ruled) developing countries, with the possible exception of high-immigration places like Australia and Singapore.
I also wondered where the IP trend line is. The trend growth from the early 2000 peak to the late 2007 peak was 1% annual growth in IP. But this might underestimate trend, as the 2000 boom was an IP-heavy business investment boom, whereas 2007 was more of a housing boom. Even so, manufacturing is a falling share of GDP, so if overall RGDP trend growth is only 1% to 1.5%, I’d guess IP trend growth rate is also pretty low. We are only 2.5% above the November 2007 peak, but IP is up 1.9% in just 2 months. If it keeps growing at 4%/year or so, we’ll quickly close the gap. Believe it or not the US economy will be “recovered” by late next year.
Bonus forecast–the unemployment rate will fall several ticks in April.
Also note that if I’m right about the recovery, it supports the argument that low interest rates are the “new normal.” Short-term rates will rise at some point, but to 2% to 3%, not the usual 5%
READER COMMENTS
Hugh
Apr 17 2014 at 10:12am
Industrial production is soaring…but eyeing the graph it seems to have gone from 101 in 2007 to just 103 in 2014.
Maybe that’s why the economy feels so bad.
Philip
Apr 17 2014 at 10:28am
“…with the possible exception of high-immigration places…” Please elaborate on this observation.
rjs
Apr 17 2014 at 11:46am
a portion of that recent IP growth is a temporary aberration; utility usage grew at a 19.5% annual rate in the 4th quarter, followed by a 17.9% growth rate in the first quarter, mostly because of the weather…although utilities is only 10% off the IP index, expect that we’ll give that back when the weather normalizes…
Scott Sumner
Apr 17 2014 at 12:14pm
Philip, They will be able to maintain faster RGDP growth because the high rates of immigration will boost their labor forces.
brendan
Apr 17 2014 at 12:17pm
Hmm. That’s a creative take, but the data is pretty noisy.
The flow of manufacturing out of the US accelerated after China’s 2001 WTO admission.
In the last few years the flow has stopped and begun to reverse due to relative wage changes, patent theft worries, and possibly because fashion caused an overshooting in the prior period.
And of course there’s lots of idiosyncratic stuff happening in mining and energy all the time.
Many reasons the level of IP growth might not reliably signal the state of recovery.
Scott Sumner
Apr 17 2014 at 8:24pm
rjs, Good point. But note that manufacturing output is up 1.9% in the past two months, exactly the same as IP. So there is real strength in the economy.
Brendan, Actually the IP data is not very noisy, it’s highly cyclical. You can easily see the major hurricanes of 2005 and 2008 in the data, which would not be possible if it was very noisy. I expect we’ll soon see confirmation in lots of other data to support my claim. There is some noise in the data, as rjs correctly pointed out, but it doesn’t impact the broad trends.
brendan
Apr 17 2014 at 10:32pm
Sorry, “noisy” was a sloppy word choice for what I was trying to describe: potential non-cyclical reasons for a change in the broad trend growth rate in IP.
I’d amplify the point you made though- the gap by which RGDP exceeded IP growth in 2000-2007 may prove unusual for several reasons.
Neat, unique stuff either way.
Scott Sumner
Apr 18 2014 at 3:56pm
Brendan, Yes, there are several possibilities, and we’ll probably know a lot more in about 2 years.
Dave Tufte
Apr 30 2014 at 11:58am
Scott: I do hope you’ll return to this thesis in another post. I’ve gone over this a few times now … and I’m intrigued … but I still don’t think I’m getting it.
Dave Tufte
Apr 30 2014 at 12:48pm
My last comment wasn’t very constructive. Let me try again.
I think my problems start with the word “secular”. This wasn’t an adjective that I (or we macroeconomists) used to use that much. It’s very trendy these days, and used in a variety of ways, so I’m not sure what you mean in this context.
1) So you say:
“… Suppose it was secular growth, what would it look like? In my view we’d expect roughly 2% to 3% growth in the major components of GDP, as output remained cyclically depressed, but grew at the trend rate (so that the recession wasn’t becoming worse.)”
By this do you mean following a line from the trough with a slope corresponding to 2-3% growth? So this means a post-recession trend that is parallel to (or maybe a little flatter), but lower than, the pre-recession trend, right?
2) I’m not sure if that’s right, so this question might be premature. You say:
“Now suppose the secular growth rate had slowed to say 1%, and the economy was briskly recovering toward that new trend line.”
So, is this then a line from the trough that is not only lower than the pre-recession trend, but a lot flatter as well. Is that what you mean?
3) Now, going back to # 1, you say “… expect roughly 2% to 3% growth in the major components of GDP …”, while for # 2 you say “… expect very rapid growth in highly cyclical sectors, and very slow growth in non-cyclical sectors …”.
To me, these quotes suggest that you’re envisioning higher economy-wide growth due to growth across both sectors, and lower economy-wide growth due to growth in only one sector. Is that right?
And … in what sense can you get “… very rapid growth in highly cyclical sectors …” if you’re getting 1% overall?
——–
I’m going to stop there. Perhaps I’ve been off track since # 1, and there’s a problem that you can fix before I dig deeper.
Comments are closed.