Stagnationists often complain about the “hollowing out” of the economy: Well-paid middle-income jobs are disappearing. Normally, they only look at the United States and other developed countries. As a cosmopolitan, however, I’d rather discover what’s been happening to incomes at the global level. Branko Milanovic’s “Global Income Inequality by the Numbers: in History and Now” (Global Policy, 2013) has fascinating answers.
The key graph:
Discussion:
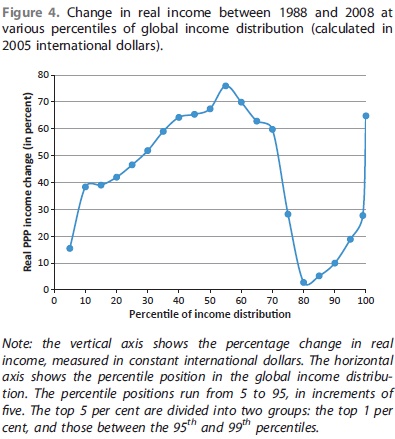
What parts of the global income distribution registered the largest gains between 1988 and 2008? As the figure shows, it is indeed among the very top of the global income distribution and among the ’emerging global middle class’, which includes more than a third of the world’s population, that we find most significant increases in per-capita income. The top 1 per cent has seen its real income rise by more than 60 per cent over those two decades. However, the largest increases were registered around the median: 80 per cent real increase at the median itself and some 70 per cent around it. It is between the 50th and 60th percentiles of global income distribution that we find some 200 million Chinese, 90 million Indians and about 30 million people each from Indonesia, Brazil and Egypt. These two groups – the global top 1 per cent and the middle classes of the emerging market economies – are indeed the main winners of globalization.
The surprise is that those in the bottom third of global income distribution have also made significant gains, with real incomes rising between over 40 per cent and almost 70 per cent. The only exception is the poorest 5 per cent of the population, whose real incomes have remained the same. This income increase at the bottom of the global pyramid has allowed the proportion of what the World Bank calls the absolute poor (people whose per-capita income is less than 1.25 PPP dollars per day) to go down from 44 per cent to 23 per cent over approximately the same 20 years.
But the biggest losers (other than the very poorest 5 per cent), or at least the ‘nonwinners’, of globalization were those between the 75th and 90th percentiles of global income distribution, whose real income gains were essentially nil. These people, who may be called a global upper middle class, include many from former communist countries and Latin America, as well as those citizens of rich countries whose incomes stagnated.
Milanovic then insightfully breaks down the distribution by country:
Who are the people in the global top 1 per cent? Despite its name, it is a less ‘exclusive’ club than the US top 1 per cent: the global top 1 per cent consists of more than 60 million people, the US top 1 per cent only 3 million. Thus, among the global top 1 per cent, we find the richest 12 per cent of Americans (more than 30 million people) and between 3 and 6 per cent of the richest Britons, Japanese, Germans and French. It is a ‘club’ that is still overwhelmingly composed of the ‘old rich’ world of Western Europe, Northern America and Japan. The richest 1 per cent of the embattled euro countries of Italy, Spain, Portugal and Greece are all part of the global top 1 percentile. The richest 1 per cent of Brazilians, Russians and South Africans belong there too.
To which countries and income groups do the winners and losers belong? Consider the people in the median of their national income distributions in 1988 and 2008. In 1988, a person with a median income in China was richer than only 10 per cent of the world’s population. Twenty years later, a person at that same position within Chinese income distribution was richer than more than half of the world’s population. Thus, he or she leapfrogged over more than 40 per cent of people in the world.
For India the improvement was more modest, but still remarkable. A person with a median income went from being at the 10th percentile globally to the 27th. A person at the same income position in Indonesia went from the 25th to 39th global percentile. A person with the median income in Brazil gained as well. He or she went from being around the 40th percentile of the global income distribution to about the 66th percentile. Meanwhile, the position of large European countries and the US remained about the same, with median income recipients there in the 80s and 90s of global percentiles…
Who lost between 1988 and 2008? Mostly people in Africa, some in Latin America and post-communist countries. The average Kenyan went down from the 22nd to the 12th percentile globally, the average Nigerian from the 16th to 13th percentile.
Fascinating stuff. My main thought: Milanovic’s results are a Rorschach test for sheer misanthropy. If you like human beings – as I do now – you’ll look at Figure 4 and say, “Wow, living standards are swiftly growing for most of mankind – especially the poor.” If you dislike human beings – as I did in high school – you’ll look at Figure 4 and say, “Horrors, living standards are stagnant for the 80th percentile, but the <scorn>super-rich</scorn> are making out like bandits.”
20/20 hindsight: No one should be like I was in high school.
READER COMMENTS
johnleemk
May 9 2014 at 11:49pm
I’m surprised you haven’t mentioned Milanovic’s work on estimating “citizenship rent” — somewhat similar to the Clemens, et al. “place premium”. This paper http://heymancenter.org/files/events/milanovic.pdf is quite interesting — here are some select quotations with the occasional added emphasis:
orthonormal
May 10 2014 at 12:35am
I can’t help feeling that the graph would have been still more informative if they’d kept on breaking down the top of the distribution (top 0.2%, top 0.04%) as far as statistically reasonable; I expect there’s more variation within the top 1% than within any other part of the graph.
That being said, I agree that the shape of global economic expansion has been really great so far from a utilitarian point of view. Inequality is a perfectly acceptable price to pay for that, as long as the political process is healthy enough to prevent cartels, collusion, and monopolies that might reverse the positive trend.
Mike W
May 10 2014 at 10:53am
“But the biggest losers (other than the very poorest 5 per cent), or at least the ‘nonwinners’, of globalization were those between the 75th and 90th percentiles…”
I was confused because the graph doesn’t really show any “losers”. But in Milanovic’s Figure 4 the vertical axis actually goes below zero and the 5th, 80th and 85th percentiles are negative.
ThomasH
May 10 2014 at 2:48pm
What about “Wow, living standards are swiftly growing for most of mankind – especially the poor. I wonder if there’s not something that would improve the rate of growth living standards that are stagnant for the 80th percentile, even if it might require higher explicit taxes on some high income people?”
Comments are closed.