Commenter Fed up directed me to an article at Yahoo discussing the squeeze on the middle class:
A survey by Pew this year found that 57 percent of Americans felt their income was trailing the cost of living — the same proportion who felt so in October 2008 when the Great Recession was raging. Just before the recession began, the figure was 44 percent.
The sensation of being squeezed persists even though the consumer price index, the most widely followed inflation gauge, has risen less than 2 percent a year since the recession ended.
One reason for the disconnect is that the CPI is weighted more heavily toward things people frequently buy — food and gasoline, for example. While child care can be a huge expense for families with young kids, not everyone faces it. So it makes up just 0.7 percent of the consumer price index.
It’s a much bigger bite in the Prosser household, however.
“We used to go out, we used to go to the opera,” Prosser said. But now, “between mortgage, bills and the child care payment, that’s pretty much everything.”
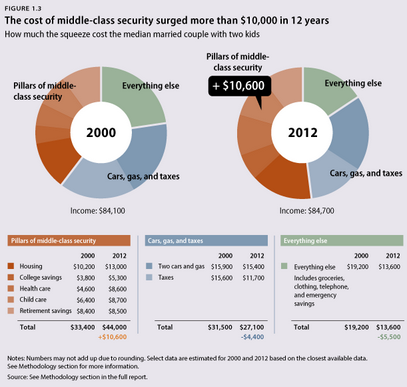
I’m skeptical. But the article did cite a fairly long piece by the Center for American Progress, which contains lots of data showing that between 2000 and 2012 the American middle class was badly squeezed, with a much smaller share of income now available for discretionary purchases like opera. (Go to link to view the graph in an easier to read size):
I thought that if the middle class really was being squeezed, this ought to show up in the GDP accounts. Americans would be spending more on necessities and less on luxuries. There is no category for “opera,” but I did find figures for “recreation” as well as “food service and accommodation” (basically hotel and restaurant.) Then I decided to contrast that with food purchased for eating outside the establishment (which is mostly groceries eaten at home.) Here’s the most recent figures, as a share of GDP, as well as the figures for the second quarter of the 2000 tech boom–which people now see as a sort of golden age:
Groceries: 2000 — 5.24% of GDP
Groceries: 2014 — 5.11% of GDP
Recreation: 2000 — 2.46% of GDP
Recreation: 2014 — 2.56% of GDP
Hotel and Restaurant: 2000 — 3.97% of GDP
Hotel and Restaurant: 2014 — 4.31% of GDP
Now a few comments. Yes, these figures don’t “prove” anything. I can imagine all sorts of objections:
1. The rich are eating out more. (But how big are the stomachs of the top 1%? And weren’t the rich already eating out as much as they wanted in 2000?)
2. People are switching to fast foods. (But isn’t McDonald’s in steep decline?)
3. The cost disease in services. (But haven’t you guys been telling me that wages for low paid workers like waitresses are stagnating? The cost disease is based on wages rising fast.)
And I’m sure there are lots of other objections. But the facts are clear. Americans are spending a larger and larger share of their incomes on luxuries, and a smaller and smaller share of their income on necessities like food. I’ll leave it to others to decide whether this sort of consumer behavior is what you’d expect from a country where living standards were supposedly being squeezed.
PS. “Breastaurants” are also booming — and somehow I don’t think that’s just the top 1%.
READER COMMENTS
RPLong
Sep 26 2014 at 9:56am
Prof. Sumner,
According to the study you cited, retirement savings barely budged in more than a decade. That alone is a huge hit to the middle class, especially since the problem compounds with time thanks to foregone interest earnings. One could make the argument that the middle class is losing its retirement to inflation, which is pretty much what the crazy Austrians have been warning us about all along.
What we need to do is track these changes demographically, and watch how things like decreased savings and massively inflating health care prices impact a person as s/he ages.
Right?
Scott Sumner
Sep 26 2014 at 10:51am
RPLong, Income and wealth data is so unreliable as to be almost worthless. That’s why I focus on consumption data. It’s not perfect, but it’s the least bad way of evaluating living standards.
RPLong
Sep 26 2014 at 11:24am
But savings data should by definition be exactly as good as consumption data, right? Maybe I don’t understand the numbers they’re reporting as savings? Is that not the inverse of consumption? I guess you’re saying that you don’t believe the savings numbers because we don’t know how much they “could have saved,” because we don’t know their wealth and incomes, do I have that right?
It doesn’t feel right to me to present consumption numbers that help your argument while calling the savings numbers from the same study “almost worthless.” If you’re willing to accept the consumption numbers, shouldn’t you have to live with the fact that the same study’s savings numbers appear to tell a very different story?
Hazel Meade
Sep 26 2014 at 1:52pm
I do see a lot of room for criticism in the charts categorizing certain things as “Pillars of Middle Class Security” and other things not. Why are groceries cars and gas not pillars of security? (And why is groceries lumped in with “everything else”?)
A less biased way to construct the chart would be to have a sector covering essentials like housing, food, utilities, car and gas, a second sector covering “middle-class security” things like health care, retirement savings and college savings/tuition, and then a third sector for luxurites like vacations, restaurants and entertainment.
My bet is that the middle part of the chart would have grown, so that would imply that its not getting more expensive to be poor, but it’s getting more expensive to maintain appropriate levels of savings. But also that many americans are also being less responsible and spending the money on luxuries instead of on retirement accounts.
Patrick R. Sullivan
Sep 26 2014 at 1:54pm
Any study that uses 2000 as the base year is seriously flawed. It’s the ultimate outlier year; the tenth year of an economic expansion.
Joe Teicher
Sep 26 2014 at 1:55pm
“But isn’t McDonald’s in steep decline?”
No. Where do you get that idea? In 2000 MCD was around $30-35/share. Now its $94. Its still making a lot of money and growing, though most growth is outside the US.
Brendan
Sep 26 2014 at 2:02pm
Prof Sumner,
According to the stats you just gave which I agree with the comment above doesn’t prove anything, just a tiny tick in recreation spending cannot possibly represent a large population the size of the United States and certainly not comparably the ’80’s and 90’s or even the ’20’s.
What it does prove is that living standards are still up :despite” the lousy “recovery”. Yet what could explain the minuscule spending could be near zero interest rates that spur spending despite household income not rising much in this recovery.
Brian Donohue
Sep 26 2014 at 3:35pm
In 2000, middle class Americans paid $15,700 in taxes and we had a balanced budget.
In 2012, middle class Americans paid $11,700 in taxes and the deficit was close to $1 trillion.
What’s the expression I’m looking for? Oh yeah- savage austerity. When will it ever end?
Daublin
Sep 26 2014 at 3:37pm
I read the graph as middle-class people choosing to spend more of their money on things like education and health care. Things that Arnold Kling calls the commanding heights of the new economy.
To the extent this is true, it doesn’t represent a “squeeze”. It’s just people putting a higher portion of their spending on certain areas–areas which, intuitively, are healthy things for our population to spend their money on.
To analyze the issue properly, the authors should have identified a level of housing, education, and health care that qualifies as providing “middle-class security”. They should then have examined the cost of that basket of goods on its own.
Andrew_FL
Sep 26 2014 at 5:17pm
I thought the “squeeze” referred to incomes in an arbitrary range being made by a smaller percentage of the people. Which results in misleading graphs that make the term “squeeze” seem very literal.
I think I am articulating what I am referring to badly here.
Hazel Meade
Sep 26 2014 at 5:39pm
Wait a minute …
Is the graph displaying what Americans coose to spend on those things, or what they would have to spend IF they wanted to maintain a middle-class standard of living ?
I.e. Are they spending more on housing because they are buying bigger houses, or because the cost per square foot has gone up?
Are they spending more on college tuition because they are more likely to go to college, or because tuition rates have increased?
Are they spending more on healthcare because they are buying more elective procedures, or because health care costs have risen?
Ryan
Sep 26 2014 at 10:25pm
The figures on recreation spending are particularly striking in light of the fact that entertainment is getting cheaper and cheaper. I used to spend money on movies; now I watch them at zero marginal cost. More broadly, the internet and smart devices provide far more entertainment than was the case in 2000. Yet recreation spending has risen. So I agree–these data work against the “squeeze” narrative.
Scott Sumner
Sep 26 2014 at 11:26pm
RPLong, The consumption data I cite is not from the same study.
Joe, Then I stand corrected. I’d recently seen a lot of articles claiming McDonalds was doing poorly–but I didn’t take a close look at the numbers.
Lorenzo from Oz
Sep 27 2014 at 3:23am
I like the following take on the CAP study (even if the rhetoric is perhaps a little overdone):
The Center for American Progress notes without embarassment that in an age where stuff made by the greedy people has gotten cheap, the services provided by the well-intentioned are driving everyone to the poorhouse.
Perhaps it is a matter of what you notice (big items getting more expensive) and what you don’t (lots of other stuff not doing so, or getting cheaper).
Don Boudreaux
Sep 27 2014 at 6:53am
On the McDonald’s issue: The New York Times‘s Mark Bittman – no market champion he, by the way – wrote a piece in the Gray Lady about two years ago explaining that meals bought at grocery stores are less costly than even are meals at fast-food restaurants. I believe, although I don’t recall with certainty, that he singled out meals at McDonald’s as examples of fast food that, contrary to popular belief, are more pricey than are (healthier) meals that one can prepare at home.
I also believe that I recall (again, though, not here with certainty) that Bittman did this calculation in several different ways – e.g., meals-per-person, and also calorie-intake-per-meal – and found that fast food is more pricey than is food prepared at home.
Don Boudreaux
Sep 27 2014 at 6:57am
Regarding my previous comment: here’s a link to the Mark Bittman piece in the New York Times; it appeared in the Sept. 24, 2011 edition:
http://www.nytimes.com/2011/09/25/opinion/sunday/is-junk-food-really-cheaper.html?_r=2&partner=rss&emc=rss&
Mike W
Sep 27 2014 at 10:38am
re: McDonald’s…”Its still making a lot of money and growing, though most growth is outside the US.”
Actually…no. Sales and income last year and this are up about 2% and the stock price peaked in January of 2012 and has been flat since. The forecast is for more of the same.
Erik R
Sep 27 2014 at 11:19am
I agree that 2000 is a questionable year to pick, but I also think there are some questionable decisions going the other way too.
I’m curious what percentage of people were married with two kids in 2000 vs 2012. If it has gone down that in itself could be a symptom of the middle class squeeze. Also, how many hours were they working? If they maintained their salary by working harder then they are being squeezed.
And I don’t like consumption data. Let’s look at the extreme. Imagine 90% of the money was held by one person. Would we then say things are OK if 90% of spending was on luxuries?
Chris H
Sep 27 2014 at 5:26pm
@Erik R
Your complaint about consumption data could be right, or the opposite could hold. What if 1% ha 90% of the income, but engages in only 5% of the consumption. Standard of living differences would be MUCH less than income data would suggest and this seems like it’s closer to how the US works given how much lower poverty measured by consumption is than poverty measured by income.
Sebastian H
Sep 28 2014 at 3:09am
Doesn’t $84,000 seem high for the middle class? Median income is much lower. ($51,000). What $33,000 are you comfortably hacking off that budget?
E. Harding
Sep 28 2014 at 2:31pm
It’s pretty clear the two biggest squeezes on the middle class are health care and housing. Looking at the CAP report, health insurance premium inflation for employees was a solid 10% per year between 2008 and 2012:
http://www.nihcm.org/images/stories/DB4-Figure5.png
Housing price inflation, however, wasn’t really an issue after the recession until 2013-14 (see the CPI for housing).
E. Harding
Sep 28 2014 at 3:02pm
The thing about fast food, though, is that it is fast, not necessarily cheap per pound or per unit of nutritional content. So it still appeals to people with little free time due to, say, long working hours. Fast food is not exactly associated with the unemployed.
RPLong
Sep 29 2014 at 9:18am
Prof. Sumner, what on Earth could you possibly mean by this? My comment was in reference to the numbers specified in Figure 1.3, the graph you embedded into your blog post.
burocracy
Sep 29 2014 at 10:51am
What’s happening here in Italy to the middle class is a triple whammy.
First off, personal taxation has been going steadily up. moreover, it’s being done in a sneaky, underhanded sort of way, by reducing deductibles, introducing and/or increasing property taxes on firms, etc.
secondly, the ECB has destroyed saving income, by reducing interest rates and therefore compressing interest rates along the goverment bond curves. more directly, the government went all in by raising tax rates on both income and capital gains; the goverment has been effectively taxing savings more than personal income, without taking into account in its economic forecasts the big negative wealth effect. this induced a GDP/tax revenue shortfall, instigating more taxes, etc.
Thirdly, a big tax push has been imposed on housing. this had two consequences, in a country with about 60% home ownership: a BIG (and I mean BIG) surtax on financial savings, since nobody can arrange a payement in kind with goverments, which alas accept only cash; and a big hit on house prices, in some more and more frequent cases below the taxed assesment values. since the private sector is (for now) still a net saver, this has not turned into a Spanish real estate moment, but it’s very difficult to say where prices would be in a clearance sale. my guess is about 30% off five years ago. “sale” signs are a permanent fixture of buidings in Torino, where I live.
The middle class here is starting to fear a massive “land grab” by the government, starting by impounding savings held in banks. rumors of a big “restructuring” of inheritance taxation are rife. Since houses are part of the Estate, in most cases a big one, many lower middle class families would face a wiping out of any financial means if they wanted to hold on to their dwellings.
hanment
Sep 29 2014 at 2:19pm
Opera? Hardly a representative purchase:
“Audiences from 2000 made up about 1.4 percent of the population, but opera has had progressively smaller shares [since] then, slipping below one percent in 2009, and farther still in 2010 and 2011.”
http://www.artsindexusa.org/wp-content/uploads/2013/09/2013-NAI-Full-Report.pdf
Floccina
Sep 30 2014 at 6:10pm
I am off topic here but…
I love that Scott included this. Rich and middle class people used to like McDonald’s but now a certain type of upper class people despise McDonald’s. They complain that it is ruining people’s health but IMHO there is nothing objective about the case against McDonald’s, it has just become so common.
I kind of think that mobile homes are so ugly to us (including me though I lived in one for a few years) partly because they are housing that is associated with lower class people.
More on topic, another issue some businesses (like my account) are still raising their rates every year. (We have not dropped him yet because of lock-in.) He is way exceeding inflation. So my theory is that even after this long there is still an assumption of inflation and some businesses are pushing their rates up. That is a good argument for NGDPLT.
Comments are closed.