Kevin Erdmann has an excellent post that discusses what really happened in the famous housing bubble and bust. It’s fairly long, so I’ll just excerpt a few highlights–but read the whole thing:
As far as I can tell, just about everyone agrees on the following series of events:
1) House prices driven up by predatory lenders, or public pressure to expand home ownership, or both, pushed low income households in homes they couldn’t afford.
2) As rates rose, low income households with unsustainable ARM mortgages couldn’t afford their mortgage payments. Delinquencies started to pile up. Home prices started to collapse as a result of families losing their homes in foreclosures, and the wider economy and labor market finally collapsed under the weight of it.
. . .
Short term rates began to rise in 2Q 2004, topped out in 3Q 2006, and remained there until 2Q 2007. In 2Q 2007, the single family home delinquency rate was at 2.3%. Please note how starkly the consensus narrative differs from reality.
In 2Q 2007, at 2.3%, single family home delinquency rates were still at the level we saw throughout the 1990’s, which ranged between 2% and 3.4%. Short term interest rates had been rising for 3 years and had been at this level for 1 year, so rate resets would have been well-baked in by this time.
. . .
So, the consensus narrative is that loose money, greedy bankers, and enthusiastic bureaucrats combined to create a housing bubble. Despite these policies, the unsustainability of dicey mortgages caused millions of households to default because they couldn’t keep up with rising rates, and this led to the crash of the bubble, despite efforts by the Fed to prop up this pretend economy.
The actual order of events is quite the opposite. (1) Tight monetary policy. (2) Rising Unemployment & Collapsing prices. (3) Delinquencies.
In the 18 months after 2Q 2007, to 4Q 2008, home prices dropped by 25%! In those 18 months, delinquencies rose from 2.3% to 6.9%. Unemployment also rose to 6.9%. In the following year, while home prices would find their bottom, unemployment would top out at about 10%. Soon after, delinquencies on single family homes would top out at 11.3%
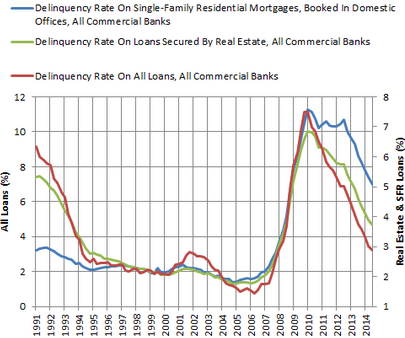
Here is one last graph, comparing delinquencies on single family homes, all real estate loans, and all loans at commercial banks. We don’t see delinquencies on single family homes rising, leading to problems in other areas. We see all three measures rising at once, as if moved by some singular exterior force. The only difference in behavior is after 2010, when policies regarding bank regulation, foreclosure processes, continued timid monetary policy, and persistent unemployment continue to create frictions in the owner-occupier home market.
. . .
Even in early 2008, after 2 years of liquidity starvation and home prices down 15%, delinquencies were under 4%. Yet, after all of this, in the infamous September 2008 FOMC meeting, the Fed held rates steady to signal that inflation was their primary concern. They soon dropped rates to the zero lower bound. Delinquencies in 3Q 2008 were still at 5.2%. Two-thirds of the rise in delinquencies happened after that meeting, with short term rates (presumably including ARM rates) near their lower bound. However, equity as a proportion of real estate began rising again in 1Q 2009, when the Fed finally reversed course and implemented QE1.
I’ve argued that the housing bust was misdiagnosed. The original weakness in housing prices and output (in late 2006) was an exogenous shock, perhaps triggered by the crackdown in immigration, which reduced the expected growth in population in the subprime states. But the biggest part of the financial crisis was an endogenous reaction to tight money—which sharply slowed NGDP growth.
READER COMMENTS
E. Harding
Feb 20 2015 at 11:48am
Scott, what do you think originally caused the housing bubbles in the U.S., Spain, and the Baltics? Dean Baker and Ron Paul both called the Housing Bubble in the U.S. back in 2002. The housing market began to collapse in April 2006.
http://research.stlouisfed.org/fred2/series/PERMIT
Kevin Erdmann
Feb 20 2015 at 12:39pm
E. Harding. The three areas you list are not unique for having “bubbles”. They are unique for having busts. Here’s an article with an interactive graph of international home prices. Just about every country listed had a “bubble”. Only a few had busts. Baker and Paul were proverbial stopped clocks.
Justin
Feb 20 2015 at 12:54pm
Though I broadly agree with his overall narrative, that is that the story’s primary drivers are a collapse in housing prices and tight money, I think there is more to the subprime ARM story than Kevin lets on.
The seriously delinquent (90+ days) rate for subprime ARMs rose far more rapidly and much earlier than subprime fixed rate mortgages or other mortgages. The following data are for the second quarter of each year. I’ve included unemployment in June for workers with only a high school degree as a proxy for economic conditions faced by subprime borrowers and the FHFA HPI housing price index.
FRM ARM Unemploy FHFA HPI
2004: 7.98% 6.45% 5.2% 306.06
2005: 6.21% 5.13% 4.8% 342.57
2006: 5.65% 6.52% 4.1% 370.43
2007: 5.84% 12.40% 4.1% 378.55
2008: 9.60% 26.77% 5.1% 361.76
It might have been that subprime ARMs simply more risky than subprime FRMs and higher interest rates didn’t matter much, but it’s important to remember that rates don’t reset right away and therefore it isn’t surprising that there might have been some lag between higher interest rates and ARM delinquencies/defaults.
I think that as subprime ARMs began to go bad and as new originations in this part of the market cooled, it was a contributing factor to slowing demand for homes and also declines in home prices which impacted the market more broadly.
That all said, I think it could take years of a careful study before anyone could really feel confident in any particular narrative. At the very least, though, the subprime market began to go bad before home prices fell and the broader economy began to turn down, though I can’t say how important that was or how exactly it happened.
njnnja
Feb 20 2015 at 1:31pm
@Justin –
The interest rate shock was much less important than many have let on. ARMs had worse performance due mostly to selection bias and geographic concentration, with the rate shock being a relative small contributor to much bigger problems. Specifically, the low rate on ARMs, and especially “teaser” intro rates allowed people to qualify at DTIs that weren’t really real. Also, these products were mostly peddled by companies such as Golden West whose lending was (not coincidentally) geographically concentrated in high price appreciation areas.
JJ
Feb 20 2015 at 1:38pm
“Dean Baker and Ron Paul both called the Housing Bubble in the U.S. back in 2002. ”
Didn’t Ron Paul also predict massive inflation by now during the 08-09 Financial crisis? Where is all the inflation that the Austrians told us would come by now?
Kevin Erdmann
Feb 20 2015 at 1:47pm
Thanks for the input, Justin. Don’t misunderstand me. I don’t mean to say that there was no subprime problem, just that it was very small in scale compared to the liquidity issue. In 2Q 2007, when your subprime ARM delinquency rates are at 12.4%, the delinquency rates on broader measures were still very low, and home prices were still basically at their peak.
The anecdotal evidence about securitizations filled with terrible mortgages, etc. are irrefutable. I just think that the focus has been too much on the starkness of the anecdotes, and not enough on the scale and timing. There was nothing inevitable about what came after 2Q 2007.
A rate cut to 4% or something in early 2006, or even sharper cuts in 2007, and the last 8 years is a totally different story.
A big problem is that everyone was so convinced that the prices of homes were out of whack, that I don’t think the country was going to be politically satisfied with good monetary policy.
The subprime market just can’t explain more than a small portion of the run up or the run down.
Andrew_FL
Feb 20 2015 at 2:01pm
@JJ-Contrary to what Ron Paul may have thought, there is nothing in Austrian theory that would predict high rates of consumer price inflation must follow from large increases in the supply of base money.
In fact, in order to make any prediction about price inflation at all, an Austrian would need to know what to expect to happen to the demand for money.
So either: Ron Paul is a politician, not an economist, or: Ron Paul underestimated the increased demand to hold money.
Possibly a bit of both, but the vast majority of Fan Club “Austrians” don’t understand the demand to hold money for some reason, so the politician part is probably more important.
Scott Sumner
Feb 20 2015 at 3:42pm
E. Harding, You said:
“Dean Baker and Ron Paul both called the Housing Bubble in the U.S. back in 2002. The housing market began to collapse in April 2006.”
That’s suggests they were wrong, housing was not overvalued in 2002.
And even if they had been right, I would have placed zero weight on that fact. In a country of 300 million people there will always be some people who correctly answer this question, ex post:
“Is the recent run-up in prices a bubble?”
You cite 2 people, I would have expected about 150 million correct answers, assuming everyone flips a coin.
I don’t know why housing prices rose in so many countries, and then fell in so few. I suspect the increase was partly driven by lower long term real interest rates, tighter building restrictions, and expectations of fast population growth from immigration.
The bust might have reflected tighter immigration policy, but the big factor was probably tight money.
Thanks for the info Justin and njnnja.
Andrew, Good point.
E. Harding
Feb 20 2015 at 3:59pm
@Scott Sumner
-Yes, housing was definitely overvalued in 2002.
http://research.stlouisfed.org/fred2/graph/?g=11yQ
E. Harding
Feb 20 2015 at 4:28pm
Also, immigration could not possibly have been an issue in the Baltics, where the population never stopped declining (except for the Year 2000 in Estonia).
Justin
Feb 20 2015 at 5:04pm
njnnja,
Thanks, that makes sense.
Kevin,
Thanks for the response. I agree that nothing was inevitable and looser monetary policy would have gone a long way, but the subprime piece seems to have exacerbated what did occur in the US, particularly given the outsized impact on new originations relative to prime loans, though it seems that the teaser rate narrative is difficult to support.
Jason
Feb 20 2015 at 5:54pm
E. Harding, that graph does not show what you think it does.
bill
Feb 20 2015 at 6:54pm
Not too long ago, I made that same point on Dean Baker’s blog. That housing prices today are about where they were in August of 2002 (adjusted for inflation) when he said they were set to fall by 11% to 22% at that time. He responded that interest rates today were so unpredictably low that he still felt vindicated.
Sigh.
Separately, I recall reading throughout the fall of 2007 that housing prices would burst and foreclosures would roll in once all the floating rate loans reset upwards. I’m sure these prognosticators view themselves as half right when in reality they were 100% wrong.
E. Harding
Feb 20 2015 at 7:10pm
bill, Jason, what are you people talking about? Stating your conclusion without explaining your reasoning is not at all informative.
Sanjeev Sabhlok
Feb 20 2015 at 8:29pm
[Comment removed pending confirmation of email address. Email the webmaster@econlib.org to request restoring this comment. A valid email address is required to post comments on EconLog and EconTalk.–Econlib Ed.]
Scott Sumner
Feb 20 2015 at 9:03pm
E. Harding, Sorry, but that graph does not show home prices to be overvalued in 2002. Not even close. Why do you think it does?
You said:
“Also, immigration could not possibly have been an issue in the Baltics, where the population never stopped declining (except for the Year 2000 in Estonia).”
Yes, that’s right. But that doesn’t really have any bearing on anything I said in the post, which focused on the US housing market.
Bill, Yes, that’s sort of a typical reaction from people who predicted a bubble and were wrong. The Economist magazine had an ad a few years back bragging about how they had predicted housing bubbles in 6 countries. And when I checked, 4 or 5 out of 6 predictions they linked to (from 2003) were totally, completely wrong!
Yes, interest rates are low, but we also had the Great Recession! Why is the low interest rate an excuse, but not the Great Recession?
Mark Bahner
Feb 20 2015 at 9:36pm
A very interesting interactive graph. However, I don’t agree “just about every country listed had a ‘bubble.'”
If I go to real prices, it looks to me like only a few countries had “bubbles.” Singapore. Ireland. The rest approximately had gains such that they were less than approximately 3 times more valuable from 1974-1979 to 2009-2014.
Mark Bahner
Feb 20 2015 at 11:23pm
Hi,
Reviewing that interactive graph again, it does look like most of the countries has significant increases in real prices in the last 10-20 years, which didn’t seem to happen in the previous 20-30 years. So I take back my last comments. It does look like most countries had a “bubble” in the last 10-20 years.
E. Harding
Feb 21 2015 at 7:13am
@Scott Sumner (also, bill, James)
-So, what would show you housing prices in the U.S. were overvalued in 2002?
“But that doesn’t really have any bearing on anything I said in the post, which focused on the US housing market.”
-If a housing bubble could exist in the Baltics during a time of strong population decline, why should one in the U.S. be explained by expectations of population growth?
bill
Feb 21 2015 at 11:22am
@ E. Harding,
I checked out the FRED graph you linked to. It differs quite a bit from the Case/Shiller graphs. Do you know why those data series would be so different? Using the Case Shiller (10 and 20 cities) graphs, housing prices today (even after adjusting for inflation) are higher today than in 2002. Looking at the FRED graph you linked to (which is inflation adjusted), housing prices today (1.25) are about 7% lower than mid 2002 (1.34). Even that doesn’t seem to meet the definition of a bubble to me. That is, I’ve never heard someone define a bubble as, “you’ll get some long run nominal gains, but you will lose about 0.5% per year after inflation in the longer run”.
Most importantly, I’m interested in hearing what you know about the FRED series compared to the Case Shiller series and why they differ.
Thanks.
bill
Feb 21 2015 at 1:45pm
I looked at CPI figures for similar time frames. Price level of 179.6 in June 2002 vs. 237.6 in Sept. 2014 (dates chosen to match figures in the FRED housing chart). So the general price level rose 32% in that 12.25 year period. So housing prices rose 23% on a nominal basis. I just don’t see a bubble. 23% is probably more than a person would have earned if they put that money into cash and the house provided actual shelter along the way.
Rob
Feb 22 2015 at 5:38pm
So Scott, say you are managing money. In 2006 many (Kyle Bass, Michael Burry, Druckenmiller, Chanos) started to build positions that would benefit from a collapse in CDO’s where the underlying collateral was housing secured by residential mortgages.
They were positive that housing was overvalued and that there would be a collapse. Were they wrong? Can you explain Bass’ $500m gain from the collapse? That’s some pretty good luck there for Mr Bass.
Your narrative basically leads to no hedging position because prices can never go down as long as the Fed targets NGDP. Why in the world do we have a $Trn funds management industry when you can never lose as long as the Fed takes care of you. You would make price redundant under your scenario and real money a worthless store of value – there would be a flight to a stronger currency.
Kevin Erdmann
Feb 22 2015 at 7:02pm
Rob, that’s the beauty of it. Less systemic risk would mean that all that effort put into hedging and speculating would now focus on production and innovation. Now investors would be less inclined to trade equity for debt to minimize cyclical risk, so debt to equity ratios would fall. And, yes, that means more currency and smaller banks.
Jeff Hummel
Feb 22 2015 at 7:31pm
I fear that Kevin Erdmann is using the wrong data on housing delinquencies. When I looked at Erdmann’s original analysis, I was struck by how different his figures were from other data I had seen dating the rise of mortgage defaults and foreclosures. The problem, I suspect, is that he is using the FRED series on mortgage loans booked at commercial banks. This involves both a seriously incomplete set of institutions and a seriously incomplete set of mortgages.
Prior to the financial crisis commercial banks held less than one-third of all outstanding U.S. mortgages as loans on their balance sheets and possibly closer to one-quarter. And these were probably the least-risky mortgages, since they had the highest capital requirements.
Around 50 percent of mortgages were securitized, and I believe listed in a different category on bank balance sheets (under securities rather than loans), given that they had much lower capital requirements. Even if Erdmann’s series include securitized mortgages held by commercial banks, which I very much doubt, that still represents a fraction of securitized mortgages. Most securitized mortgages were held off bank balance sheets, either in bank-owned structured investment vehicles or in other institutions altogether, such as investment banks and hedge funds.
This would explain why Erdmann’s timing on delinquencies is not consistent with, for instance, the data from the Mortgage Banker’s Association, and available from the Richmond Fed.
Scott Sumner
Feb 22 2015 at 7:50pm
Mark, Of course the important point is that most of those countries did not see their housing prices crash after the sharp price runup—the US was the exception.
E. Harding. Many factors can cause housing prices to rise rapidly. In the Baltics it may have been the 10% annual GDP growth, in the US it might have been rapid population growth combined with strict zoning. I’m sure dozens of other factors also played a role. There is no reason to assume the same factors are involved in all cases.
On your other question, why don’t you tell me what it is about that graph that leads you to the conclusion that houses in the US were overpriced in 2002. Then I’ll tell you why you are wrong.
It’s very difficult to show market inefficiency, you need sophisticated statistical analysis.
Rob, You said:
“Your narrative basically leads to no hedging position because prices can never go down as long as the Fed targets NGDP.”
Actually, asset prices can easily go up or down if you are targeting NGDP, I’m not sure where you got the idea they could not.
Again, you’d expect about 150 million out of 300 million people to guess correctly on a coin flip, or whether a particular asset class will outperform the overall market. To cherry pick a few people that did well, ex post, means absolutely nothing. The people who guessed right about the housing collapse merely got lucky–most of those that I’ve read about have done poorly in the years since, which is what you’d expect when people get lucky.
Thanks Jeff, Let’s see if we can get a response from Kevin.
Kevin Erdmann
Feb 23 2015 at 12:17am
Jeff,
That is a valid criticism. Is there a public source for comprehensive supply-side data on delinquencies? I’ve seen those graphs, but I don’t think I can get the data.
I went with the Fred data despite it’s potential weakness, because the timing appears to be about the same as the Richmond Fed data. The Commercial Bank delinquencies begin to rise in mid-2006, then accelerate in 2007, and accelerate again in 2008. I don’t see much difference in the Richmond data.
There is a difference in level, because the default rates are higher in the subprime and ARM series that they break out, but I think if you applied a constant coefficient to them and pulled them down to the conventional mortgage level, they would look similar. Also, their importance is overstated in a graphic format like that. They may have been 20% of originations at the high point, but I don’t know if they ever were more than 10% of loans outstanding. So, even if they were defaulting at a rate of 25%, they just wouldn’t amount to a large proportion of the total – even less so in dollar terms.
But, all that said, it is possible that more comprehensive data could slightly alter my narrative.
On the third hand, I have been digging into the Fed’s Survey of Consumer Finances, to get at the story from a household point of view, and I continue to be surprised. There isn’t a subprime/conventional distinction in that data, but there is income data. For instance, I am surprised to find that the marginal new loans were to high income households. Homeownership didn’t increase in the bottom 2 quintiles. Imputed rent/income levels declined and debt payment/income levels were level among homeowners during the boom. I hope to have a couple of posts up soon.
This adds more mystery than answers, though. I mean, there were a lot of subprime loans, and they did default at a higher rate than normal loans. Were these to high income households? Although, as high as defaults were, they were actually very low compared to previous default levels in subprimes – at least until 2006.
Kevin Erdmann
Feb 23 2015 at 2:25pm
Here’s my first follow-up.
W. Peden
Feb 24 2015 at 3:07am
It reminds me of how many people just assumed that M1 and broad money had increased dramatically in the early 1930s, until Friedman & Schwartz. The main difference is that proponents of the “bubble -> burst -> financial crisis -> macroeconomic crisis” narratve don’t even have the excuse of lacking reliable and easily available data.
Kailer
Feb 24 2015 at 12:47pm
One thing I’m interested in is why so many developed countries saw a big run up in home prices between 2000 and 2007Q2. The US wasn’t the only country where prices peaked in 7Q2, it was global. Here in Alberta NGDP grew by 6.0% in 07 and 13.9% in 08, in-migration was at an all-time high, and yet house prices were falling after 7Q2. The same was true for house prices in Britain, New Zealand, Australia, Denmark, France, but curiously not Germany, Switzerland or Japan. As per the economist interactive chart.
Kevin Erdmann
Feb 24 2015 at 1:18pm
Here’s my second follow up.
Scott S.
Mar 8 2015 at 8:27am
I can tell you from personal experience how I lost my house. When Home values skyrocketed my house which I paid $97,000 for in 2000 at the peak was valued for over $270,000 and property taxes correspondingly went through the roof which drove up my escrow and raised my mortgage payment from $900 to over $1350 at which point I couldn’t make the payments anymore.
This was on top of the fact that I had not had a raise since the late 90’s and inflation was driving the cost of everything up while my income stayed the same.for example my water bill in the nineties used to be $27 it is now almost $50 most of that is trash services. All the other utilities have gone up, food has, gas went up,insurance, you name it it went up. I make roughly $40,000 a year which was good money in 2000 but is barely getting by today.
[N.B. This commenter is a different Scott S., not Scott Sumner. –Econlib Ed.]
Comments are closed.