When I was in grad school in the late 1970s, there was increased interest in the “monetary ineffectiveness proposition”, which posited that money was neutral and monetary policy did not impact real variables. There was virtually no interest (at Chicago) in the claim that monetary policy could not impact nominal variables, like inflation and NGDP. By the early 1990s, there was no interest in the nominal ineffectiveness view in any university that I’m aware of.
And yet today I see lots of people denying that monetary policy can control nominal variables. They often make arguments that are completely irrelevant, such as that the monetary base is only a tiny percentage of financial assets. That would be like saying the supply of kiwi fruit can’t have much impact on the price of kiwi fruit, because kiwi fruit are only a tiny percentage of all fruits.
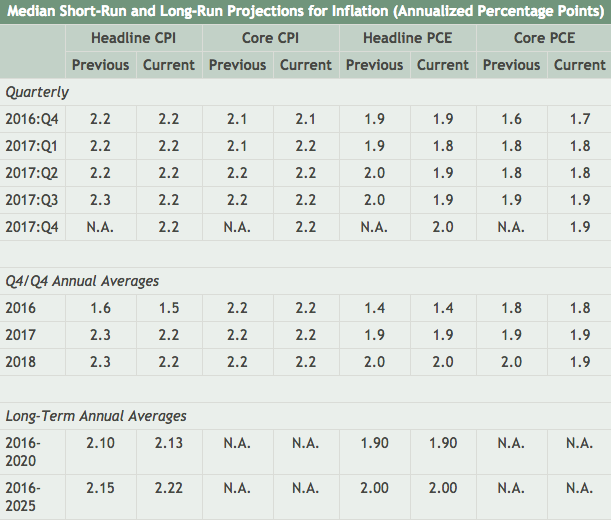
Beyond the powerful theoretical arguments against monetary policy denialism, there’s also a very inconvenient fact for denialists; both market and private forecasters seem to believe that monetary policy is effective. Let’s take a look at the consensus forecast of PCE inflation over the next 10 years (from 42 forecasters surveyed by the Philadelphia Fed):
Notice that most of those numbers are pretty close to 2%. The Fed’s official long run target is headline PCE inflation, however in the short run they are believed to target core PCE inflation, which factors out wild swings in oil prices. Core PCE inflation is expected to come in at 1.8% this year. That may reflect the strong dollar, which holds down inflation. They forecast 2.0% inflation for the 2016-2025 period.
Now think about how miraculous that 2.0% figure would be if monetary policy were not determining inflation. Suppose you believed that fiscal policy determined inflation. That would mean that professional forecasters expected Trump and Congress to come together with a package to produce exactly 2% inflation. But I’ve never even seen a model explaining how this result could be achieved. People who like the fiscal theory of the price level, such as John Cochrane, usually talk about the history of inflation in the broadest of terms. Thus inconvenient facts such as the fall in inflation just as Reagan was dramatically boosting deficits are waved away with talk of things like the 1983 Social Security reforms, which reduced future expected deficits. But unless I’m mistaken, there’s no precision in those models, no attempt to explain how fiscal policy produced exactly the actual path of inflation. (This is from memory, please correct me if I’m wrong.)
Another counterargument might be that 2% inflation is “normal”, and thus might have been caused by some sort of structural factors in the economy, not monetary policy. But of course it’s not at all normal. Prior to 1990, the Fed almost never achieved 2% inflation; it was usually much lower (gold standard) or much higher (Great Inflation and even the Volcker years.) Since 1990, we’ve been pretty close to 2% inflation, and this precisely corresponds to the period when the Fed has been trying to achieve 2% inflation. Even the catastrophic banking crash of 2008-09 caused inflation to only fall about 2% below target, as compared to double digit deflation during the 1931 crisis.
So private sector forecasts seem to trust the Fed to keep inflation at 2%, on average. But how can the Fed do that unless monetary policy is effective?
How about market forecasts? Unfortunately we don’t have a completely unbiased market forecast, but we do have the TIPS spreads:
Notice the 5-year and 10-year spreads are both 2.01%. That’s actually closer to 2% than usual, but a couple caveats are in order. First, the CPI is used to index TIPS, and the CPI tends to show higher inflation that the PCE, which is the variable actually targeted by the Fed. So the markets may be forecasting slightly less than 2% inflation. Notice the Philly Fed forecast calls for 2.0% PCE inflation and 2.22% CPI inflation over the next decade. So perhaps the TIPS markets expect about 1.8% PCE inflation.
On the other hand, TIPS spreads are widely believed to slightly understate expected CPI inflation. That’s because conventional bonds are somewhat more liquid than TIPS, which means they are presumably able to offer a slightly lower expected return. If so, then expected CPI inflation is slightly higher than the TIPS spreads. To summarize, the TIPS markets are probably predicting slightly above 2.01% CPI inflation, and the expected PCE inflation rate is about 0.22% below that. In other words, TIPS markets predict that PCE inflation will run about 0.22% below a figure that is slightly above 2.01%. That sounds like a figure not very far from 2.0%!
Thus both private forecasters and market participants seem to be expecting roughly 2% PCE inflation going forward. There are lots of other figures they could have predicted, including the 4% inflation of 1982-90, or the zero percent average of the gold standard, or the 8% figure of the 1972-81 period, etc., etc. Why 2.0%? Is it some miraculous coincidence? Or is it because the Fed determines the inflation rate, and people expect the Fed will deliver roughly on target inflation, on average, for the foreseeable future?
Just to be clear, I’m not saying the forecasts will always be this close. I would not be shocked if the next Philly (quarterly) forecast bumped up to 2.1%, perhaps reflecting the impact of Trump’s election. My point is that it’s difficult to explain any figure that is close to 2% with a “fiscal theory of the price level”. Or “demographics”. You need to focus on monetary policy, which drives the inflation rate. And that means, ipso facto, that monetary policy also determines NGDP growth. If trend RGDP were to slow, the central bank could simply raise the inflation target to maintain stable NGDP growth. Thus NGDP growth is not driven by structural factors such as productivity, regulation, demographics, fiscal policy, etc., it’s determined by the Fed.
There is no question in my mind that the Fed could generate a 4% average rate of NGDP growth, or any other figure. The only question is whether or not they wish to.
PS. Of course there’s lots of other evidence against denialism. For instance, exchange rates often respond strongly to unanticipated monetary policy decisions, and almost always in the direction predicted by monetarists, and denied by denialists.
PPS. I’m not a Holocaust denialist, a global warming denialist, or a monetary policy denialist. But I am a fiscal policy denialist and a conspiracy theory denialist, so I’m not opposed to denialism, per se.
PPPS. Regarding the kiwi example, an even better analogy would be the claim that a stock split of Disney can’t affect the nominal price of individual Disney shares, because Disney is only a small share of the entire stock market. Of course that’s wrong, and so is monetary policy denialism.
READER COMMENTS
Thomas Hutchesoon
Jan 16 2017 at 10:48am
I think what lies behind the view of ineffectiveness is persistently seeing that monetary policy has failed to maintain full employment and price stability. Since 2008 the failings on the unemployment side have been more egregious, but there have been systematic deviations from maintaining the trend level of price level increase as well. If one assumes that monetary policy making is unconstrained, then this can imply that policy does not have the ability to do the job.
I do not agree with that. I think that policy can do a far far better job, but it would imply that the Fed were much more willing to use unconventional policies (and perhaps to discover new ones such as buying and selling NGDP futures).
But so long as the Fed is restricted to using changes in ST interest rates as virtually the only instrument of policy and constrained not to allow the inflation rate to exceed 2%, monetary policy will be relatively impotent in fulfilling its dual mandate and many people will interpret this impotence as ineffectiveness.
David R. Henderson
Jan 16 2017 at 11:09am
@Scott Sumner,
But I am a fiscal policy denialist and a conspiracy theory denialist
Isn’t this too broad? To deny conspiracy theories per se, you would have to deny that there have ever been conspiracies. Do you think, for example, that the 19 9/11 murderers didn’t conspire?
Scott Sumner
Jan 16 2017 at 11:28am
Thomas, Those are good points, but they can all be easily accounted for without resorting to monetary policy ineffectiveness. On the other hand there is simply no “denialist” explanation for the facts in this post, as I think even you would admit.
I would add that inflation forecasts and long run past inflation are most relevant to this question, whereas past inflation in the short run is subject to swings due to various shocks, or mistakes by the Fed. And both inflation forecasts and inflation since 1990 are roughly 2.0%. The Fed sets the trend, even if they fall short during recessions.
And it’s not the case that the Fed views 2% inflation as a ceiling, as inflation has run above 2% on numerous occasions such as 2002, 2004, 2005, 2006, 2007, 2009, and 2011, using Dec. to Dec. figures.
David, I meant “conspiracy theory” in the common everyday use of the term, as for instance those who claim the CIA produced the 9/11 attacks, or was behind the Kennedy assassination. You are absolutely correct that conspiracies do occur.
David R. Henderson
Jan 16 2017 at 11:54am
@Scott Sumner,
You are absolutely correct that conspiracies do occur.
Good. I’m glad we’re agreed on that. I like what the late British libertarian Chris Tame said: “I’m not interested in conspiracy theories. I’m interested in conspiracy facts.”
BTW, every prosecutor I’ve ever heard of believes in conspiracy theories.
Britonomist
Jan 16 2017 at 12:21pm
New Keynesian econ have models where a certain inflation level becomes ‘baked in’, it becomes a self fulfilling prophecy that remains stable in the absence of monetary shocks. Also your claim comparing base to financial assets is misleading, it’s not that it’s a tiny percentage of “financial assets”, it’s that it’s a tiny percentage of money, period.
BC
Jan 16 2017 at 12:54pm
Here is how King Solomon might deal with those that claim to believe that central banks can’t control inflation (also related to your last post about Japan and the liquidity trap). Suppose we were to bet on whether inflation over, say, the next 10 years would exceed or fall below 2%. You have two options:
(1) You get to choose whether you want to be long or short inflation but, in this case, I get to control the central bank for the next 10 years; or
(2) I choose whether to be long or short inflation and you get to control the central bank.
If someone truly believed monetary policy was ineffective, they would choose (1). For example, if they thought Japan was in a liquidity trap, they would want to be short inflation and wouldn’t care if I got to control the BoJ. Would anyone in their right mind actually choose (1)? If so, I would love to bet against them. If only a country would let us control their central bank so that we could resolve this bet…
On a related note, hedge fund managers are incented with performance bonuses. Why don’t we incent Fed Chairs (or the entire Board?) with bonuses that are tied to how closely inflation matches their target? For example, at the end of her 4-year term, the Chair would receive a bonus based on the 4-yr inflation rate over her term. That would turn the target into a 4-yr level target. Of course, a bonus tied to 4-yr NGDP growth would be even better.
Don Geddis
Jan 16 2017 at 1:36pm
“I’m not opposed to denialism, per se.”
Best phrase in the whole post! Destined to be a classic.
Maurizio
Jan 16 2017 at 2:59pm
Wow, this post is very useful as a reference to be linked in discussions. 🙂
Anybody knows why TIPS are less liquid?
E. Harding
Jan 16 2017 at 11:24pm
Solid post. Note other countries do, indeed, have inflation rates very far away from 2%, so this 2% expected rate must be at least first-world specific.
Noah Smith
Jan 17 2017 at 12:29am
Japan can’t seem to hit its inflation target, though.
Scott Sumner
Jan 17 2017 at 8:11am
Britonomist, Yes, but those very same NK models tell us that monetary policy determines the rate of inflation. I’m interested in models that deny that. How do they explain 2% inflation?
BC, In one of my papers I discussed incentive bonuses for Fed chairs, indeed the entire FOMC.
Noah, Interestingly, I addressed that in my previous post. It might be pressure from the US that prevents them from doing so.
http://www.econlib.org/archives/2017/01/liquidity_traps_1.html
However.
1. Japan was very close to zero percent inflation during the period where price stability was their target (1990s and 2000s.)
2. Since 2012, Japanese inflation has risen, right after the 2% target was set. I don’t recall the average since the beginning of 2013, I think about 1.0% to 1.5%
3. Thus it’s too soon to say whether Abenomincs will achieve its goal. I agree it may not, but they’ve also faced headwinds of sharply falling energy prices. My hunch is that current policy would deliver 1% inflation going forward, but 2% is within reach if they further depreciate the yen. It’s their choice.
Jeff
Jan 17 2017 at 8:35am
It is pretty hard to explain how the Fed can hit an inflation target but couldn’t possibly hit a nominal GDP target. But if the latter is possible, it’s only a short step to conclude that the Fed could have prevented or at least greatly ameliorated the Great Recession. Better for the Fed’s defenders to deny the efficacy of monetary policy altogether.
Scott Sumner
Jan 17 2017 at 9:14am
Britonomist, Yes, the base is only a part of the overall money supply. But base money is not even close to being a perfect substitute for bank deposits.
Jeff, Yes, and even more broadly it would imply the economics profession as a whole was partly culpable for 2008, by refusing to demand greater monetary stimulus in 2008, when rates were still above zero.
Gene Callahan
Jan 17 2017 at 9:31am
David, what Scott means is that he only will believe in conspiracy theories our elites tell him it is acceptable to believe in (the Russians hacked our elections) and will vigorously deride any conspiracies that our elites tell him are infra dig (the CIA is trying to stage a coup).
Market Fiscalist
Jan 17 2017 at 11:32am
‘But I’ve never even seen a model explaining how this result could be achieved.’
Well, if there was no central bank and only fiscal policy and the govt wanted to hit a 2% inflation target it could surely do so by running a 2% deficit funded by money creation, and then using a fine tuning instrument (like a variable sales tax) to adjust the money supply for fluctuations in the demand for money. This would work as well as monetary policy, but have the disadvantage that people might not like short-term fluctuations in tax policy as much as they like monetary policy (and perhaps would not trust the govt to implement fairly).
David R. Henderson
Jan 17 2017 at 11:47am
@Gene Callahan,
I’ll let Scott speak for himself, as I think you should too. But I do think you’ve put your finger on the danger of dismissing conspiracy theories. Just as there are good economic theories and bad economic theories, there are good conspiracy theories (that is, those that hold up to evidence) and bad conspiracy theories (that is, those that don’t hold up to evidence.)
Someone who taught both Scott and me, Milton Friedman, once said, and probably said more than once, that we economists should make sure we do good economics, not bad economics. The same applies to conspiracy theories.
Like Scott, I doubt that the CIA was behind the JFK assassination, but all I have is doubt. I don’t have the certainty that Scott has and I don’t know what’s behind that certainty.
Gene Callahan
Jan 17 2017 at 4:49pm
David, what Scott means is that he only will believe in conspiracy theories our elites tell him it is acceptable to believe in (the Russians hacked our elections) and will vigorously deride any conspiracies that our elites tell him are infra dig (the CIA is trying to stage a coup).
Neil Wilson
Jan 18 2017 at 3:39am
Perhaps by looking outside the USA?
Scott Sumner
Jan 18 2017 at 4:31pm
Market, I strongly disagree, I don’t think you could target inflation that way, and even if you could it would have no bearing on my post.
Gene, When did I say I believe in the conspiracy theory about Russia hacking the election? I don’t recall saying that.
Since you posted that comment twice, I’d like you to also post a link of me saying that.
Scott Sumner
Jan 18 2017 at 4:34pm
Gene, Perhaps you are confused about another point. I do believe the theory that Trump asked the Russians to release hacked Hillary Clinton emails, because he did so publicly at a press conference.
Since it was on national TV, I don’t view that charge as a conspiracy theory.
Market Fiscalist
Jan 18 2017 at 6:56pm
Scott, it may not have any bearing on your post but I don’t see how adjusting the money supply via fiscal policy will work any less well than adjusting the money supply via monetary policy when the aim is hit an inflation target. In any case ultimately any inflation target hit by monetary policy will surely lead to an equivalent amount of future fiscal policy as the assets of the CB acquired to drive inflation provide profits that are returned to the govt.
Jim Glass
Jan 19 2017 at 12:38am
“Perhaps by looking outside the USA?”
Yes, let’s look…
~~~
Some Monetary Facts
https://www.minneapolisfed.org/research/qr/qr1931.pdf
“Money Growth and Inflation
“In the long run, there is a high (almost unity) correlation between the rate of growth of the money supply and the rate of inflation. This holds across three definitions of money and across the full sample of countries and two subsamples.
“The evidence on the long-run relationship between the rate of money growth and the rate of inflation from our sample of 110 countries is presented in Table 1…”
Comments are closed.