In the comment section of a recent post, Thomas Hutcheson and I discussed what would happen if there were a financial crisis without tight money (defined as sharply falling NGDP growth.) It’s not easy to find examples, because financial crises are often caused by slowing NGDP growth.
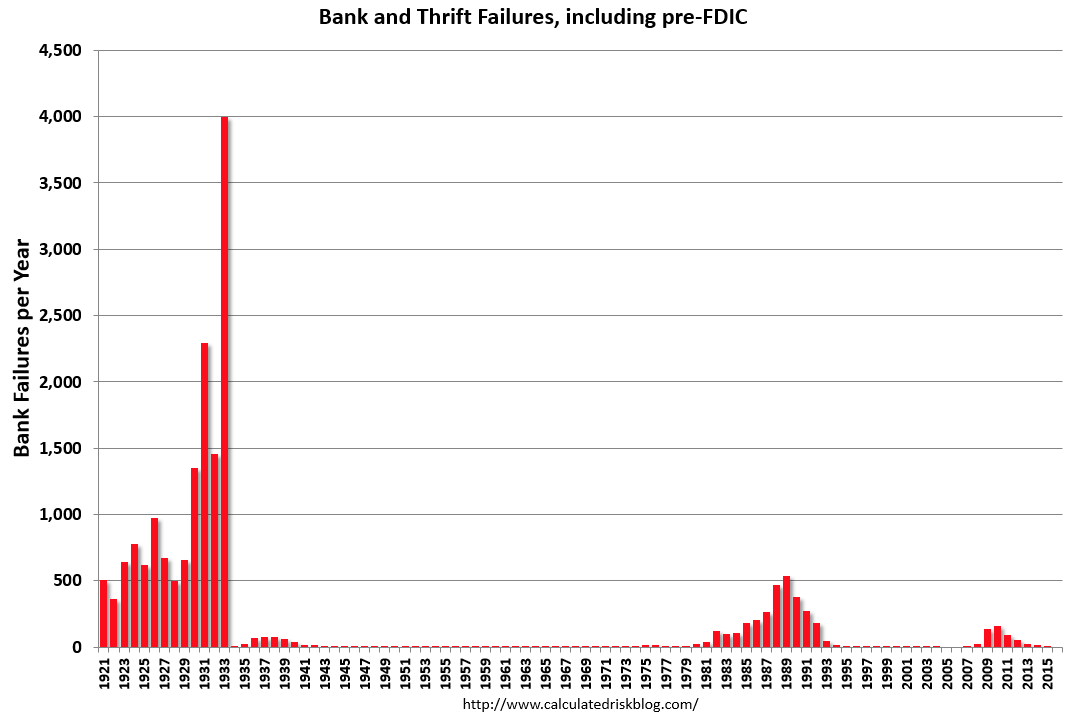
Here’s a graph of the number of bank failures in the US each year, from a post by Bill McBride:
The next graph takes a closer look at recent decades. Notice that bank failures peaked at roughly 500 per year in 1988-89. This remains the largest number of failures since the Great Depression.
So how did the financial crisis affect RGDP growth? Growth was about 4% during those years, pretty robust when considering that we were fairly far along in the recovery (growth is often faster during the period when unemployment falls rapidly, such as 1983-84):
Why was growth strong despite the financial crisis? Because monetary policy kept NGDP growing at a robust rate:
Actually, the 8% NGDP growth was excessive, and helps to explain why we fell into recession in late 1990. But even a 6% NGDP growth rate would have prevented the financial crisis from causing a recession (and might have also helped us to avoid the 1990-91 recession.)
Let’s consider some objections:
1. You could argue that 2008 was different, as we also had a huge stock market crash. But in late 1987 we had a stock market crash roughly the size of the famous 1929 crash. That means we avoided recession in 1988 and 1989 despite BOTH a 1929-style stock market crash and the largest number of bank failures since 1933.
2. You could argue that the 2008 bank crisis was more severe; indeed the entire banking system froze up during the fall of 2008. That’s true, but even after the Fed (and Treasury) provided liquidity and rescued the system in October, the economy continued to plunge downhill in November, December, January, February and into March. Only when the Fed switched to a more expansionary monetary policy in mid-March did the stock market, and later the economy, begin to improve.
3. You could argue that 2008 was different because we were at the zero bound. Except that we were not, at least not until mid-December 2008. The Eurozone didn’t hit the zero bound until about 2013, and yet they had a recession just as bad as the US.
4. You could argue that we didn’t have a housing slump in 1988-89, except that we did. Home prices fell in many key coastal markets during the late 1980s, and home construction slumped during this period:
Yes, the housing slump of 2006-09 was even worse, but during the first half of that slump the economy was not even in recession.
Before you put too much weight on the differences between the late 1980s and 2008, I want you to consider the following:
Despite the highest levels of bank failures since 1933, and despite a stock market crash of 1929 proportions, and despite a real estate slump, the economy of 1988-89 actually accelerated to above 4% RGDP growth. In other words, not only were these shocks not severe enough to cause a deep recession, they didn’t even cause a tiny slowdown in growth.
Are the things that you think caused the 2008 recession really enough orders of magnitude worse than 1988-89 to explain the difference between no economic slowdown at all and the worst recession since the 1930s? Seriously?
Or, do the very different paths of NGDP growth during those two periods better explain the dramatic difference in the path of RGDP growth?
READER COMMENTS
Matthias Görgens
May 25 2017 at 4:12pm
Very interesting! Do people have examples from other countries, too?
Bahrum Lamehdasht
May 26 2017 at 5:27am
“Despite the highest levels of bank failures since 1933, and despite a stock market crash of 1929 proportions, and despite a real estate slump, the economy of 1988-89 actually accelerated to above 4% RGDP growth. In other words, not only were these shocks not severe enough to cause a deep recession, they didn’t even cause a tiny slowdown in growth.”
I don’t think there can be any doubt that the global financial meltdown of the late 2000s was not caused by a financial crisis and bank failures etc. Just because the economy did not slow down during the late 80s, it doesn’t mean that if those factors occurred again they would not affect the US economy in the late 2000s. Besides, the propagation mechanisms are different now than in the 1980s. You could argue that the world economy has become more inter-connected over the last 25 years, especially with regards to financial interdependence. Investment in the US housing market, for instance, arguably, is more global than ever. Surely wide-spread bank failures, falling confidence in the stock market and tumbling real estate values hitting consumers, firms, investors and governments around the globe would cause a recession in this day and age.
Scott Sumner
May 26 2017 at 9:48am
Thanks Matthias.
Bahrum, I think you missed the point. Whether it would cause a recession or not doesn’t depend on how the world is more “interconnected” than in 1989, but rather on whether monetary policy allows NGDP growth to fall.
In any case, the (developed) world was also highly interconnected in 1988. The difference is not all that great.
Richard Heddleson
May 26 2017 at 5:44pm
Are the things that you think caused the 2008 recession really enough orders of magnitude worse than 1988-89 to explain the difference between no economic slowdown at all and the worst recession since the 1930s? Seriously?
Yes, seriously. But it may take some time to explain.
The charts show bank and THRIFT failures. I’d be willing to bet that over 90% of the failures in the 80’s were thrifts, notwithstanding the first too big to fail failure of Continental Illinois which was not systemic but due to fraud. They were not failing because of poor asset performance; the thrifts were failing because of the removal of Reg Q. The original deal for the thrifts was that they could borrow short and lend long because their cost of funds would be constrained by Reg Q. After it went away the money cascaded out to NOW accounts and CD’s and thrifts had to go to the hot money market where they paid rates well above the rates on the mortgages they had on the books. But their mortgagees were still making payments regularly on homes that had been financed in the relatively low rate 60’s and 70’s. And none of it affected the Commercial Banks.
Most of those thrifts were also relatively small. If those graphs showed the assets of failed institutions as a percent of total assets, the size of the humps would probably be reversed.
It was clear to all what was happening and why. There was no general panic, only a recognition that the thrifts would not survive and that the FSLIC could not absorb the losses, so the Resolution Trust Corporation was created to socialize the loss. It all happened in an orderly fashion.
In addition, the baby boomers had pretty well entered the market and births per year were rising, creating additional demand.
By 2008 the financial system had been transformed from the New Deal design. Starting with Reg Q, we got holding companies, repeal of Glass-Steagell, interstate banking, investment banks turning into trading houses, joint-stock investment banks, securitization of debt, significant concentration of assets and a deterioration in credit standards for mortgage borrowers. No one really knew how it worked.
Then it became clear that mortgagees were not paying on their loans and that the securitized debt on balance sheets was not worth its stated value. But no one really knew how bad it was because no one really understood the new system. Panic ensued, unlike the ‘80s. McCain suspended his campaign, We got TARP and a bloated Fed balance sheet. And the effects of that panic are still being felt on Main Street. That’s why absolute number of births declined from 2007 to 2013.
And the boomers were at the end of their work lives, saving every penny they could while the Millenials, burdened with student debt and surrounded by economic panic provided little additional demand.
The difference isn’t in charts or numbers. It is in the animal spirits and the lack thereof. And it’s no coincidence it came 80 years, a lifetime, after the last true panic.
Scott Sumner
May 27 2017 at 9:46am
Richard, I don’t agree with many of your points. For instance, you point out that most of the bank failures of 1988-89 were quite small. But the exact same statement could be made about 2008-09.
You said:
“In addition, the baby boomers had pretty well entered the market and births per year were rising, creating additional demand.”
This is wrong, Monetary policy controls demand, a higher rate of population growth creates more supply. Don’t confuse aggregate supply with aggregate demand.
You said:
“The difference isn’t in charts or numbers. It is in the animal spirits and the lack thereof. And it’s no coincidence it came 80 years, a lifetime, after the last true panic.”
First of all it is a coincidence. Second, what you (and Keynes) call “animal spirits” is just a metaphor for expected NGDP growth. If you read the General Theory it is clear that when Keynes is talking about animal spirits, he is referring to something very much like expected NGDP growth. And that’s the key difference in 2008—money was much tighter, and the falling NGDP led to lower RGDP.
There is one other problem with your answer. You have not addressed the issue of how the 2008 crisis would have affected the broader economy, had NGDP growth been maintained at a rate close to 5%.
Bahrum Lamehdasht
May 27 2017 at 7:23pm
@scottsumner, I don’t think I’ve missed the point.
You said:
Are the things that you think caused the 2008 recession really enough orders of magnitude worse than 1988-89 to explain the difference between no economic slowdown at all and the worst recession since the 1930s? Seriously?
Or, do the very different paths of NGDP growth during those two periods better explain the dramatic difference in the path of RGDP growth?
I believe yes, to your first question. Or at least, the impact of the factors that caused the 2008 recession were enough orders of magnitude worse than in 88. And I would argue no to the second question.
Also, I would agree with Richard’s point about animal spirits. Why would his point be a coincidence? Surely your hypothesis is a coincidence if you can only give limited examples. Fair enough, you admit it’s hard to find examples because financial crises are often caused by slowing NGDP growth, but won’t that then mean that your argument is not robust?
Anand
May 28 2017 at 9:02am
In the case of 1988-89 (and after), doesn’t a naive interest rate story also explain the facts? The effective federal funds rate rose sharply in 1988-89 from about 6.5% in March 1988 to a peak of 9.8% in May 1989. After this peak, the effective federal funds rate fell continuously until the end of 1992, when it reached 3%.
This tool was not available in 2008-09 because interest rates fell sharply.
Anand
May 28 2017 at 9:03am
The last sentence should read: “federal funds rate fell to zero in Jan 2009”.
Comments are closed.